Question widgets are set up a bit differently than other chart widgets. Each Question Stage is set up as it's own widget, then you adjust which Question Types and Components show up in the widget.
We've pre-set these to accommodate all programs and question volumes. However, there might be types or stages you don't need and you can remove them.
Terms:
- Question Type: The format of the question for your participants i.e. Scale, Text, Multiple Choice, All that Apply.
- Question Stage: Where participants see the question in their Habit Builder experience i.e. Prep, Session, Commitment, Reflection.
- Question Component: Specific visualization included for that Question Type i.e. chart, table, average (single value).
To get started: make sure you working in a custom report you've saved, and not an Actionable Preset. (Learn about copying Presets here).
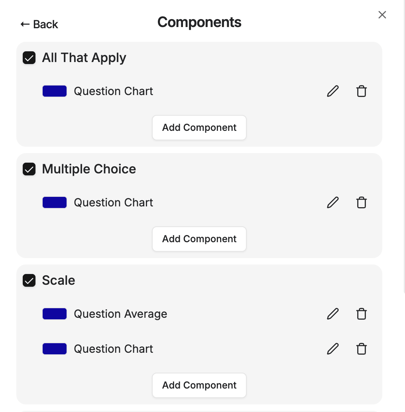
Change question stage and/or components:
- Hover over your widget, then click on the "edit" icon
- Click "Update/Next"
- Change the Stage if applicable
- Add or remove Types if applicable
- For each type, add or remove Components if applicable
Change colors:
- Hover over your widget, then click on the "edit" icon
- Click "Update/Next"
- Select the Component you'd like to edit (click the edit icon)
- Under "Chart Color" you can:
- click on a square from the palette and it will show as the selected option.
- click "Pick" to select from a general color picker.
- add your own hex code in the field.
- see the selected color in the single square beside the hex code.
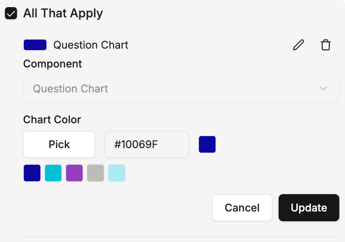
- Click "Update" then "Done." (Or select another Component).