
You'll have some or all of these options available to help tailor both the data and insights you include in your report, and the way you present them. You'll need to make sure you working in a custom report in "My Dashboards", and not an Actionable Preset. (Learn about copying Presets here).
Quick Links:
For details on how to edit existing widgets, check out this article instead: How Do I Edit a Widget on my Dashboard
Download All Journal Entries
A spreadsheet of all journal entries can be accessed without needing to build a report
Steps:
- Go to the Module or Session screen in the platform
- Click on the Reports tab
- Choose Export Participant Journals to CSV
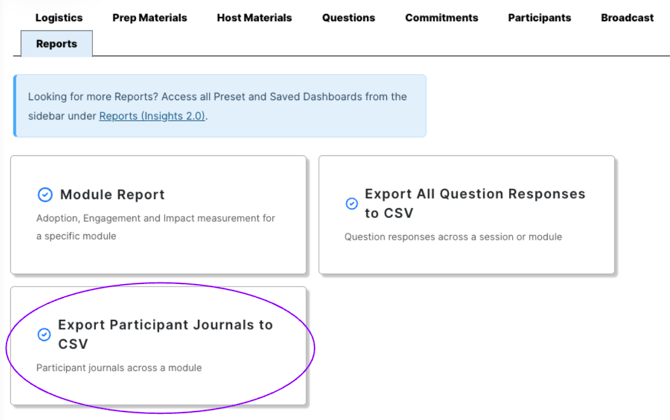
Journal Entries in Reports
-
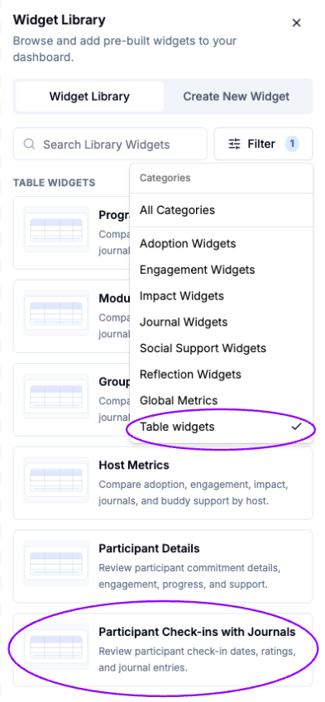
Open the Widget Library
-
Filter for Table Widgets
-
Choose Participant Check-ins with Journals
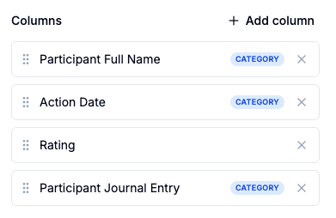
- Add or remove columns as desired from the edit window
-
Make sure to click Save Changes to add changes to your dashboard.

Journal Sentiment
Each participant journal entry gets assigned a sentiment: positive, negative, neutral, or mixed. Using these sentiments can give an overall picture of how participants are feeling and how that is changing over the course of their commitments.
Overall Journal Sentiment
-
Open the Widget Library
- Filter for Journal Widgets
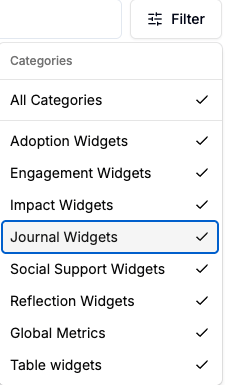
- Choose the Journal Sentiment Distribution widget
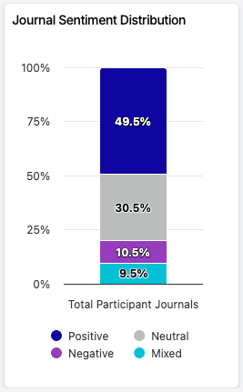
- Use this widget to see the overall breakdown in journal sentiment among all the commitments represented by your filter values.
Journal Sentiment by Commitment Week
-
Add a Journal Sentiment Distribution widget to the dashboard (see above steps)
- Change the breakdown category to "Commitment Action Week" and add an additional breakdown for Journal Sentiment.
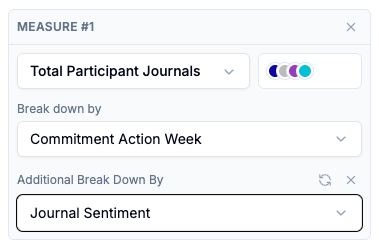
- Use this widget to see how sentiment has progressed over the time participants have been working on their commitments. In this example, positive sentiment has increased as participants have progressed and negative sentiment has decreased.
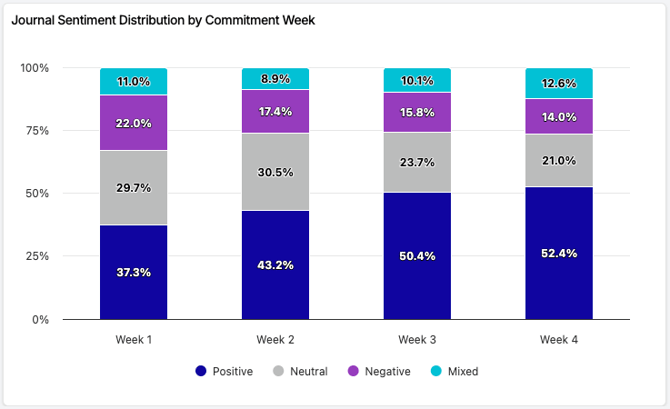
-
Make sure to click Save Changes to add changes to your dashboard.
Tip: Both of these can be created by starting with a blank stacked bar chart, in which case the measure to use is Total Commitments
Journal Summaries
Each participant journal entry gets assigned a sentiment: positive, negative, neutral, or mixed. Using these sentiments can give an overall picture of how participants are feeling and how that is changing over the course of their commitments.
Steps
-
Open the Widget Library
- Filter for Journal Widgets
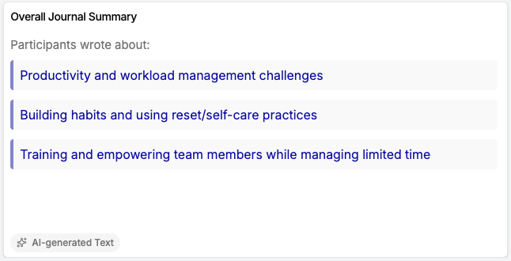
- Choose the desired widget(s). Overall Journal Summary summarizes all journals whereas the rest summarize only journal entries with that assigned sentiment.
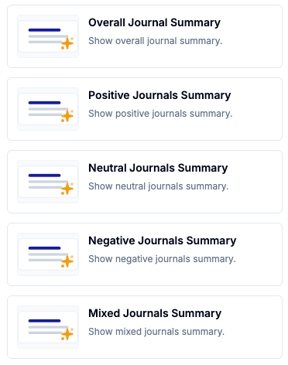
-
Make sure to click Save Changes to add changes to your dashboard.
Summaries need at least 3 journal entries to work. If there are fewer than three, the widget will show a message indicating that there aren't enough entries.
Video Walkthrough of Journal Analysis
To make more changes to your created widget (colors, label sizes, widget-level filters, etc) see How Do I Edit a Widget on my Dashboard