
On most licenses, you'll have some or all of these options available to help tailor both the data and insights you include in your report, and the way you present them. You'll need to make sure you working in a custom report in "My Dashboards", and not an Actionable Preset. (Learn about copying Presets here).
Quick Links:
For details on how to work with Question Widgets, check out this article instead: How do I use Question Widgets
Open the widget editor:
- Open your custom dashboard in "My Dashboards."
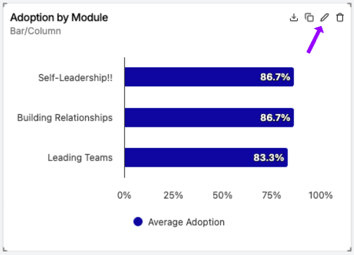
- Hover over the widget you'd like to edit.
- Click the edit icon.
General Settings
These are the essential settings for a widget that you can tailor to your needs.
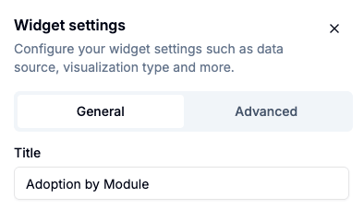
Change the title of the widget
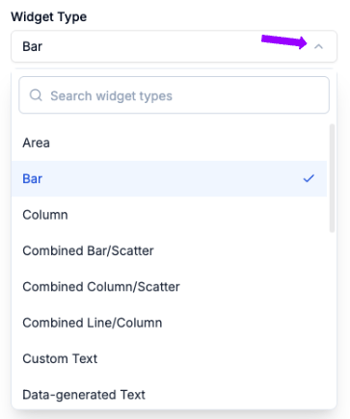
Change the chart type
Scroll the list or use the search bar in the drop down list under "Widget Type."
Change the Measure type
Scroll the list or use the search bar to find the Measure you want.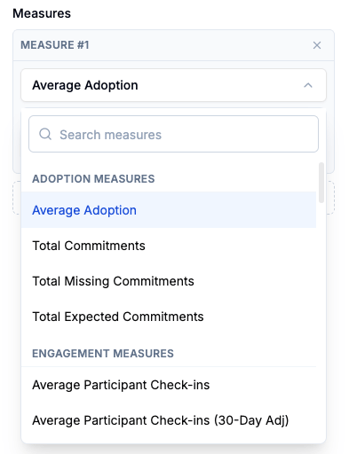
Change the data breakdown
Customize how you'd like to show the data in your selected Measure to match your audience. You can adjust the content lens (Themes to Program objectives), program lens (from Modules to Groups), or client-specific people lens with Custom Fields you've set up.
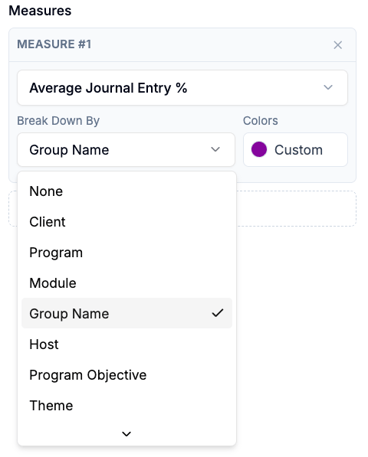
Change the color of the Measure
You can change the colors of your charts by changing the color of the Measure.
-
Under Measures, click the current color of the Measure.
-
Choose from the existing palette in the list or enter a hex code.
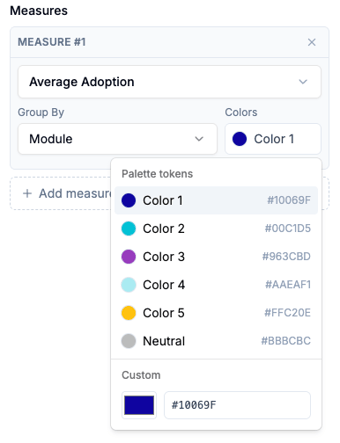
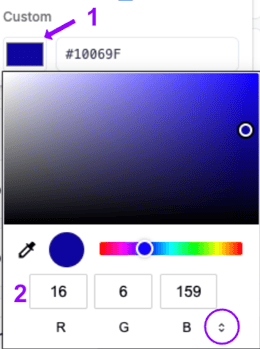
- To add a custom color, click the color shown, then enter the desired color
- To change the color format (RGB, hex, or HSL), click the arrows near the field labels.
- Make sure you click "Save Changes" to add new colors to your widget.
Add Measures
-
Click "Add measure" under the existing measure(s)

- For the new measure, choose the specific measure, breakdown, and color
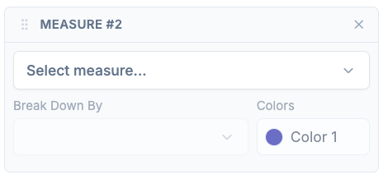
- Make sure you click "Save Changes" to add new measures to your widget.
Advanced Settings
For those looking to tailor the look and feel of their report, these options offer more granular formatting of the charts in your widgets and the data they show.
Click on the "Advanced" option in the Widget Settings sidebar to get started.
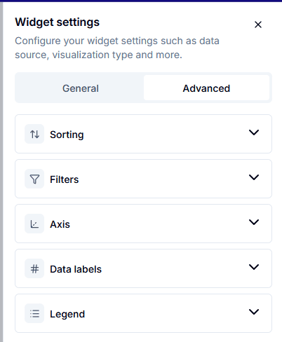
Sorting
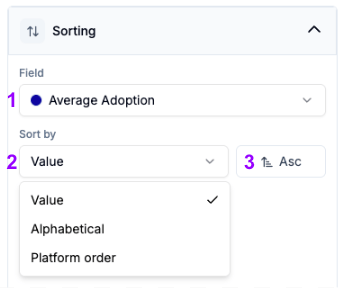
You have control over how the data is sorted in the widget to showcase the data in the way that has the most impact.
-
Choose the field to sort by (in most cases, there will only be one option).
- Choose how to sort the field:
- Value sorts by the number
- Alphabetical sorts by the value label
- Platform order shows for certain group bys, like Module, that have a particular and meaningful order in the platform
- Choose whether this sort should be Ascending (least to greatest, A to Z, first to last) or Descending (greatest to least, Z to A, last to first)
- Make sure you click "Save Changes" to add new measures to your widget.
Widget-level filters
Some situations may call for filters on specific widgets only rather than the whole dashboard. For example, if you want a widget that shows only one group in order to compare them to the rest of the program.
-
Check the box to enable widget filters
-
Click "Add filter"
-
Choose the filter you want to add
-
Make sure you click "Save Changes" to add new measures to your widget.
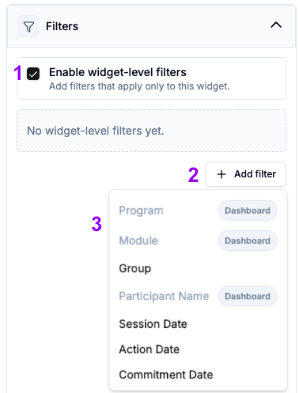
Note: Filters that are already included in the dashboard filters will be grayed out with the word "Dashboard" next to them. In order to use these as widget-level filters, first remove them as dashboard filters.
Axis customization
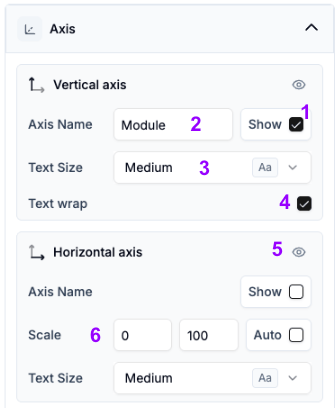
On the Axis dropdown you can change the way the numbers appear on your widgets in the following ways:
- Decide whether the axis name will show
- Change the axis title (only available if "Show" is checked)
- Adjust the size of the axis labels
- Set the text to wrap
- Hide the values of a specific axis
- Change the scale of an axis (it will default to Auto)
Data label customization
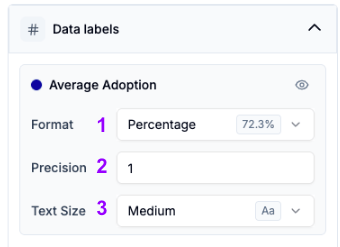
You can change the way the numbers appear on your widgets in the following ways:
-
Change the format
Note: Use this with caution. Metrics will default to the correct format. - Adjust the precision (number of decimal points)
- Set the text size to small, medium, or large (default is medium)
- Make sure you click "Save Changes" to add new measures to your widget
Legend customization
-
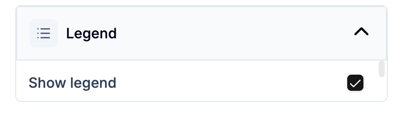
Click the checkbox to show the legend
-
Make sure you click "Save Changes" to add new measures to your widget
For details on how to make similar changes to Question Widgets, check out this article instead: How do I use Question Widgets